The Nevada Gaming Control Board (NGCB) released its annual Gaming Abstract, which provides a 12-month fiscal summary of Nevada casinos' performance across their business channels.
The casino sector in Nevada had a successful year in 2022, reaching a new high in net income from gaming, hotel rooms, food and beverage, and entertainment. Overall, Nevada Casinos Set New Record with $4.12B Net Income in the 2022 Fiscal Year.
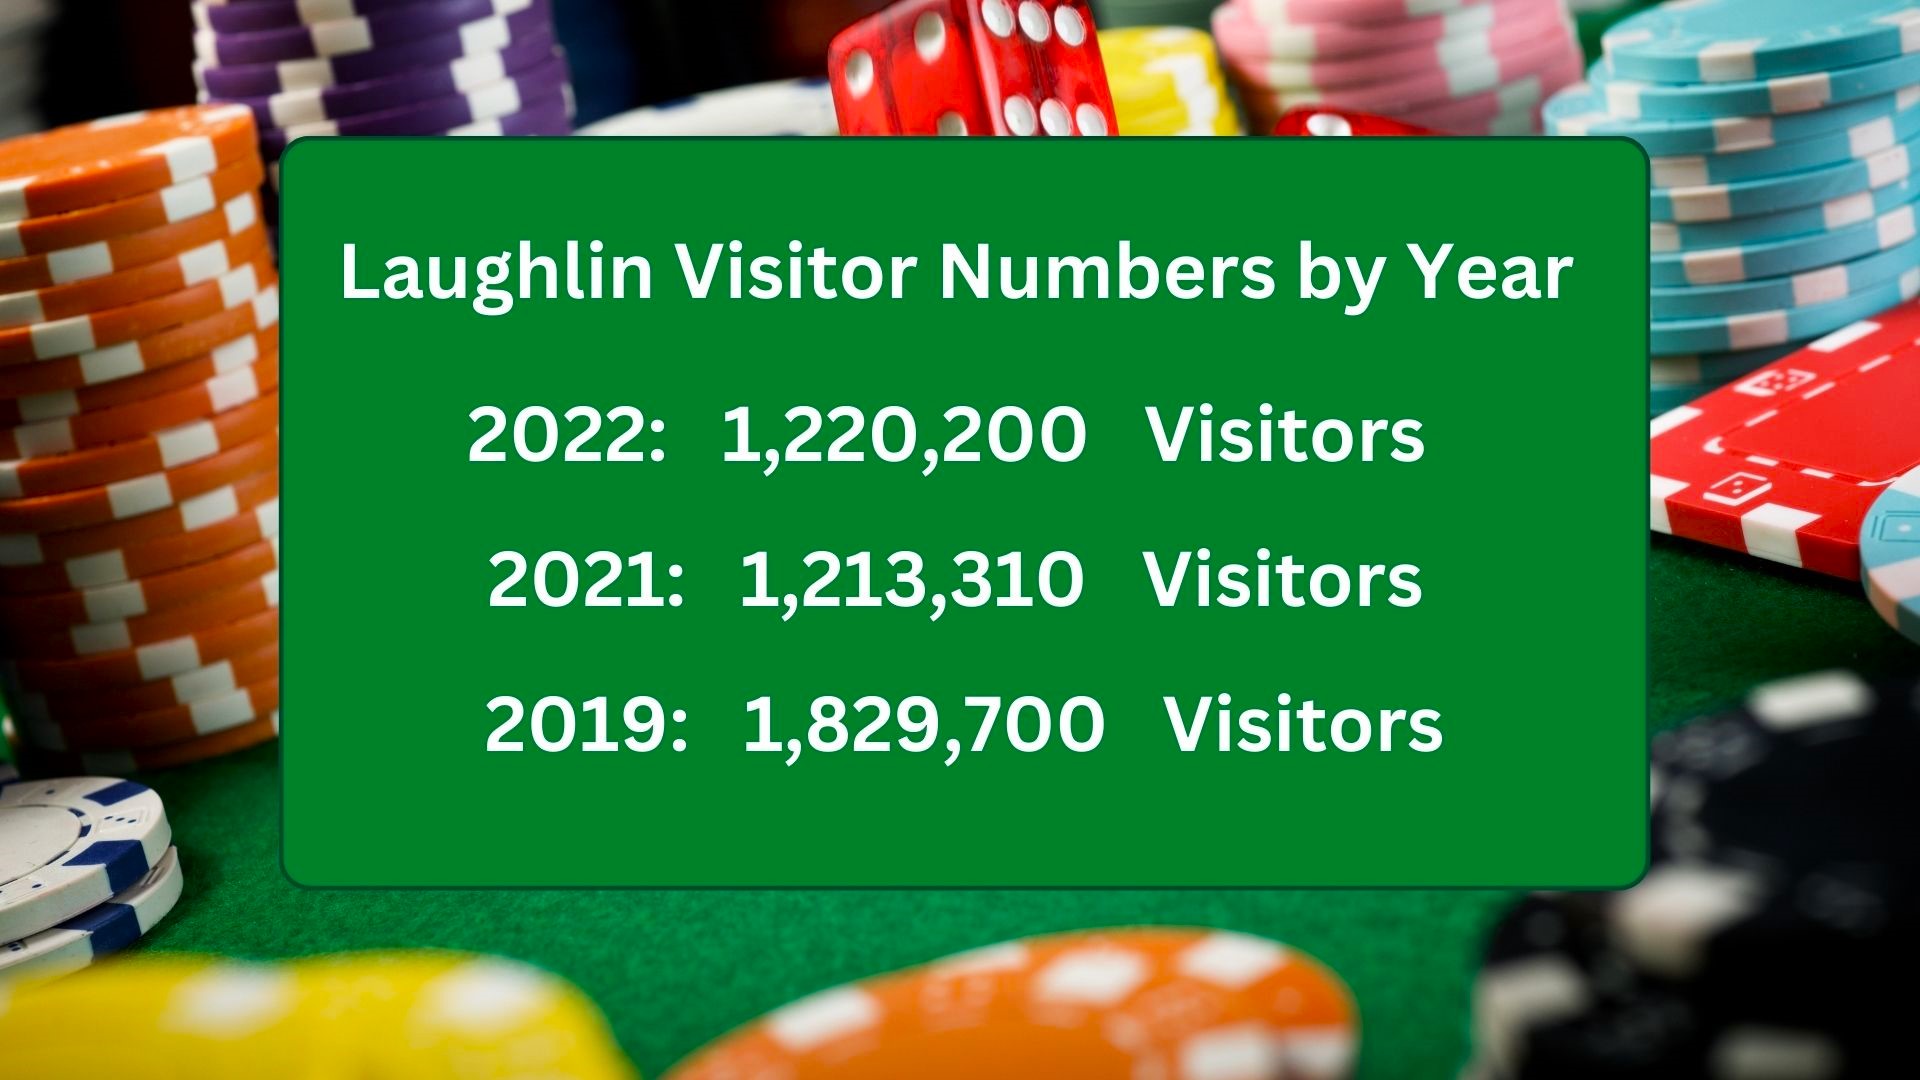
How did Laughlin Casinos Do?
Laughlin Casinos Net Income was up +33.4% at $81,203,308.
Gaming Revenue $379,025,802 +7.5%
Total Revenue $663,588,898 +12.0%
Net Income/Loss $81,203,308 +33.4%
Total Revenue Breakdown:
Gaming $379,025,802 57.1%
Rooms $123,640,651 18.6%
Food $56,702,297 8.5%
Beverage $60,057,551 9.1%
Other $44,162,597 6.7%
Gaming Revenue Breakdown:
Table Games (Includes Keno and Bingo) $38,752,426 +10.2
Slot Machines $482,651,365 +127.3
Card Games (poker, pan, etc.) $2,880,891 +0.8
Race Book $46,295 0.0
Sports Book $201,090 +0.1
Contra Revenue (Complimentary Expense) (145,506,265) (38.4)
Room Revenue Breakdown:
Room Sales $67,843,285 +54.9
Complimentary Room Sales $58,117,931 +47.0
Contra Revenue (Complimentary Expense) (2,320,565) (1.9)
Food Department Dollars:
Food Sales $41,905,853 +73.9
Complimentary Food Sales $15,982,728 +28.2
Contra Revenue (Complimentary Expense) (1,186,284) (2.1)
Total Revenue $56,702,297
Cost of Sales $18,683,234 +32.9
Gross Margin $38,019,063 +67.1
Totals for Room Occupancy for Fiscal Year 2022
Rooms Available 2,701,282
Rooms Occupied 1,440,127
Percentage Occupied +53.3
Average Room Rate Per Day $87.47
The abstract report only includes casinos that grossed at least $1 million in gaming revenue during the fiscal year 2022. 296 casinos met this benchmark. These casinos generated net income of $4.12 billion on revenue of $26.36 billion, a significant rebound from 2021's loss of $206.5 million on revenue of $16.1 billion. The entire Gaming Abstract can be read a
https://gaming.nv.gov/modules/showdocument.aspx?documentid=19377
Note:
Fiscal Year 2022 - The fiscal year for gaming revenue for Nevada from the Gaming Control Board is from July 1st to June 30th.
“Total revenue” is the money spent by patrons on gaming, rooms, food, beverage, and other attractions.
“Net income/loss” is the money retained by casinos after expenses have been paid but prior to deducting federal income taxes and prior to accounting for extraordinary expenses.
Thank you to Best of Laughlin Sponsors